Build Dashboard
Live server status. Your history, your dashboards.
We recommend ClickHouse and Grafana for exploring your StatHub history. Preserve raw server samples, compare several machines, and switch from a fleet overview to a single server with one dropdown.
1. Enable ClickHouse export
Start with a self-hosted StatHub instance and a ClickHouse server reachable from it. Keep your existing agents reporting to StatHub; export happens centrally through the Aiursoft ClickHouse SDK.
Deploy StatHub · Install ClickHouse
Merge this section into your StatHub appsettings.json, replace the host and credentials, then restart your StatHub instance:
{
  "MetricsExport": {
    "Enabled": true,
    "ConnectionString": "Host=clickhouse;Protocol=http;Port=8123;User=stathub;Password=replace-with-your-password;Database=StatHubMetrics",
    "RetentionDays": 30,
    "MaxBufferedSamples": 100000
  }
}
For Docker, configure the same settings with environment variables such as MetricsExport__Enabled=true and MetricsExport__ConnectionString. Use your deployment's secret configuration for the real password. Inside a container, localhost refers to that container; use a reachable ClickHouse hostname.
The exporter needs permission to create its database, table, and view, and to insert and select metrics. On the first non-empty batch it creates StatHubMetrics.ServerMetrics and the deduplicated ServerMetricsLatest view automatically.
Use ClickHouse export under Monitoring to choose which servers to export. Its independent policy supports all servers, explicit inclusions, and exclusions; exclusions always win.
Raw samples are batched every five minutes rather than reduced to five-minute averages. The initial retention is 30 days. Changing RetentionDays later does not alter an existing table's TTL. The buffer is bounded and held in memory; a restart loses samples that have not been written yet.
2. Check your first batch
Let agents report and wait for a five-minute export cycle. In ClickHouse, check that servers and recent receipts appear:
SELECT ClientId, argMax(Hostname, ReceivedTime) AS server,
       count() AS samples, max(ReceivedTime) AS last_receipt,
       round(avg(HasSampleTime) * 100, 1) AS source_time_percent
FROM StatHubMetrics.ServerMetricsLatest
WHERE SampleTime >= now() - INTERVAL 15 MINUTE
GROUP BY ClientId
ORDER BY server;
Query ServerMetricsLatest for dashboards so retries do not inflate your results. HasSampleTime=1 means the agent supplied the source timestamp. Older agents use receipt time and mark HasSampleTime=0; samples in one report may share a timestamp, so their exact source timing and order are unavailable.
3. Connect Grafana to ClickHouse
Install Grafana and the official Grafana ClickHouse data source plugin. Add a ClickHouse data source with the hostname reachable from Grafana, HTTP port 8123 for this example, and StatHubMetrics as the default database. Use Save & test to verify the connection.
Use a separate read-only Grafana account with SELECT permission on both ServerMetricsLatest and its underlying ServerMetrics table. Keep the exporter credentials in StatHub.
Set Grafana's Query Timeout to 15 seconds. In the ClickHouse reader's settings profile, use readonly=1 and max_threads=2, and allow max_execution_time to change in read-only mode with CHANGEABLE_IN_READONLY, as described in the official configuration guide.
4. Add a server dropdown
Create a dashboard and add a Query variable named Server using your ClickHouse data source. Enable Multi-value and Include All, leave Custom all value empty, and refresh the variable on dashboard load. Use this query:
SELECT ClientId AS value,
       concat(argMax(Hostname, ReceivedTime), ' [', substring(ClientId, 1, 8), ']') AS text
FROM StatHubMetrics.ServerMetricsLatest
WHERE SampleTime >= now() - INTERVAL 24 HOUR
GROUP BY ClientId
ORDER BY text;
The ClickHouse plugin reads the first column as the value and the second as the display text. ClientId keeps machines separate even when names match. Search and select one or several servers, or choose All. This menu lists servers reporting within the last 24 hours; reload to discover new servers.
5. Build your resource panels
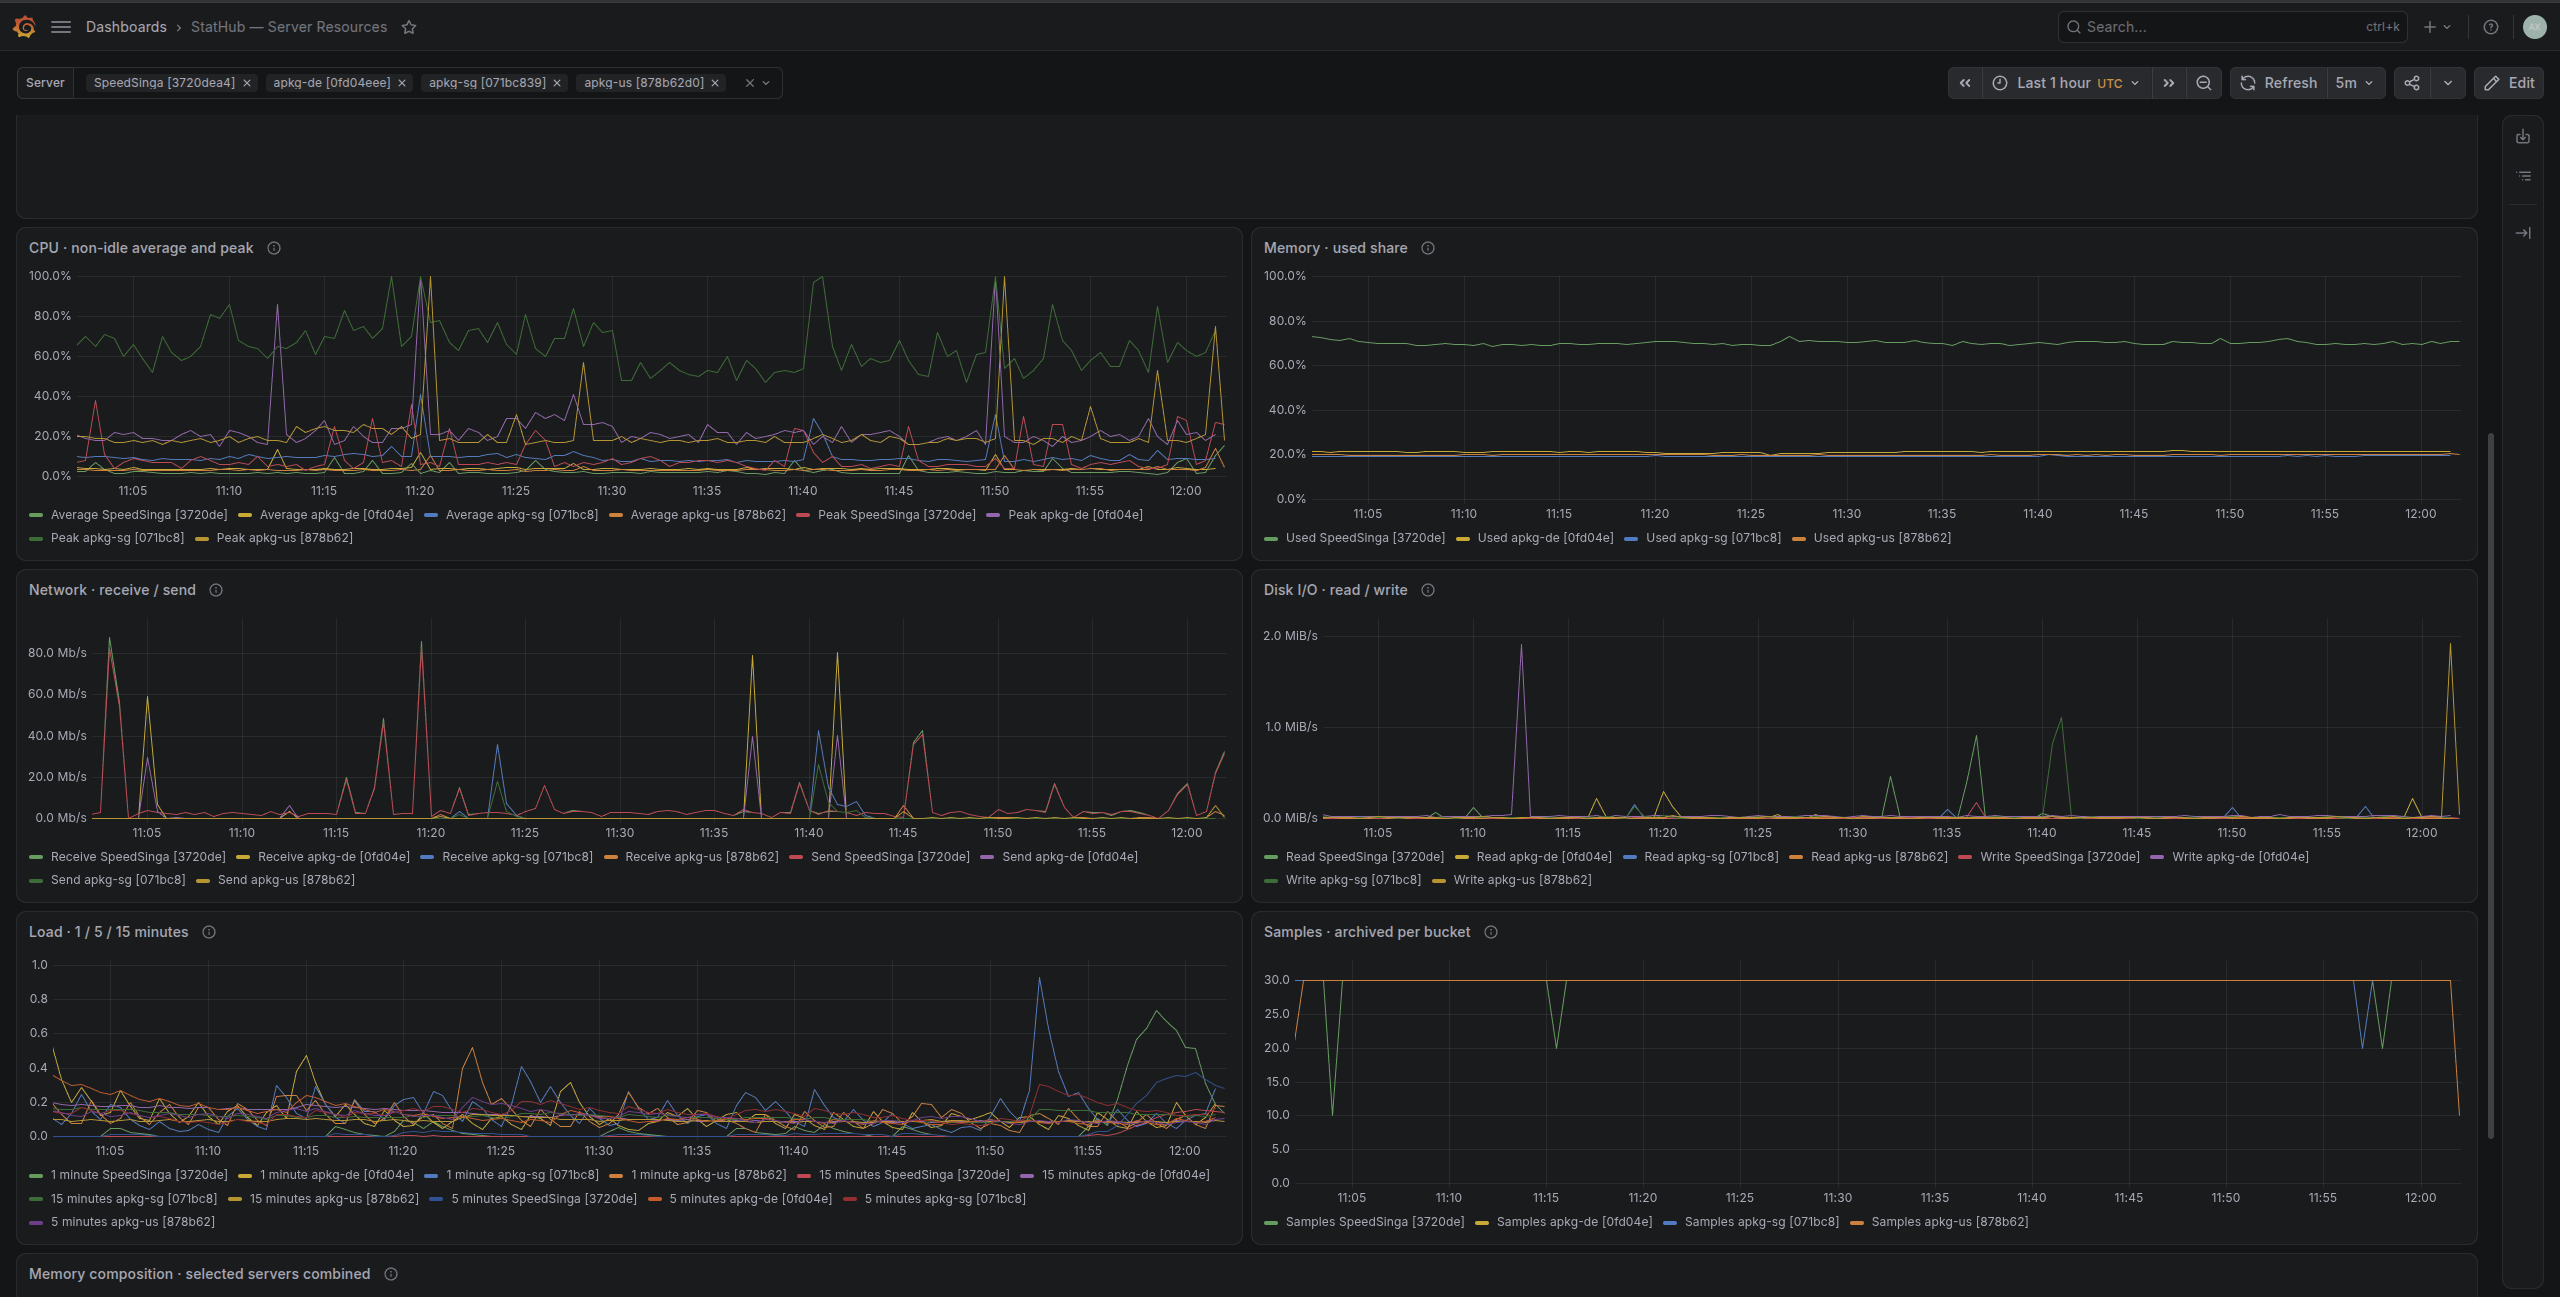
Add a Time series visualization with your ClickHouse data source and SQL query type Time series. Start with CPU average and peak:
SELECT
    toStartOfInterval(SampleTime, toIntervalSecond(greatest($__interval_s, 30))) AS time,
    concat(argMax(Hostname, ReceivedTime), ' [', substring(ClientId, 1, 8), ']') AS server,
    avg(100 - CpuIdl) AS average,
    max(100 - CpuIdl) AS peak
FROM StatHubMetrics.ServerMetricsLatest
WHERE SampleTime >= $__fromTime AND SampleTime <= $__toTime
  AND $__conditionalAll(ClientId IN (${Server:sqlstring}), $Server)
GROUP BY time, ClientId
ORDER BY time;
Set the CPU unit to Percent (0-100). Keep the time and server filters when adapting the query to other panels. All removes the server restriction; individual selections use safely quoted ClientId values.
| Panel | Metrics and units |
|---|---|
| Memory | Used percent: MemUsed divided by MemUsed + MemFree + MemBuf + MemCach, times 100. Return null when the total is zero. Plot the four fields separately for memory composition. |
| Network | Average NetRecv and NetSend, multiplied by 8 / 1000000, for Mbps. |
| Disk I/O | Average DskRead and DskWrit, divided by 1048576, for MiB/s. |
| Load | Average Load1M, Load5M, and Load15M. These are raw load averages, not CPU percentages. |
| Samples | Count archived samples in each time bucket to see reporting gaps and batch arrivals. |
Network and disk fields are already rates in bytes per second; do not apply rate or derivative again. CPU core counts and disk capacity are not exported. Memory used share is not Linux MemAvailable.
For an overview table, group by ClientId and show recent averages, peaks, and max(ReceivedTime). Avoid treating a metric chosen from tied receipt timestamps as the exact last sample.
Start with the last six hours in UTC, a five-minute dashboard refresh, and about 720 points per series. Keep a minimum 30-second bucket and let it grow for longer ranges. Leave missing data empty instead of filling it with zero. Data age is not proof that a server is offline.